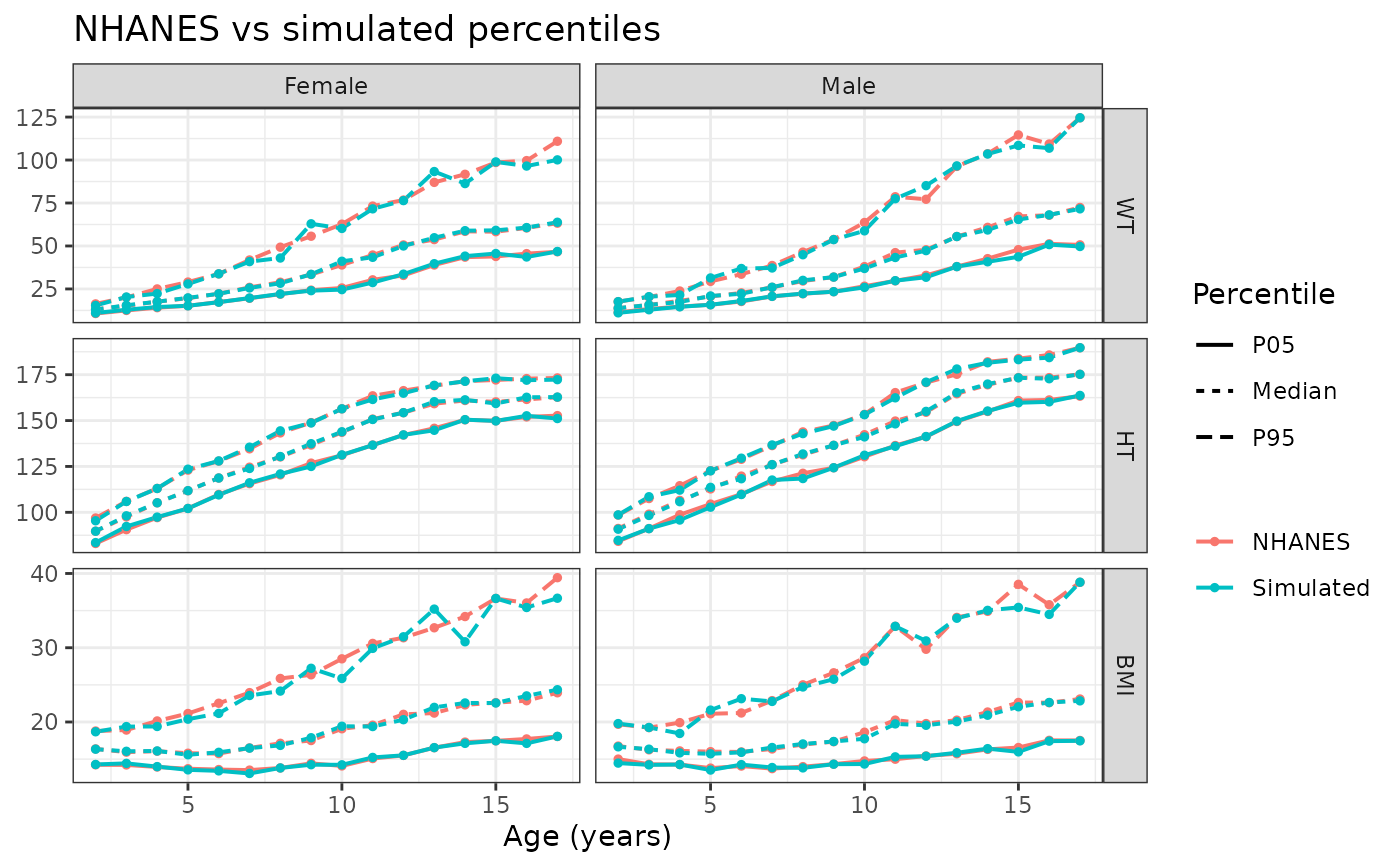
Plots the 5th, 50th and 95th percentiles of each simulated measure against age, for the simulated population and the NHANES reference, by sex.
Arguments
- comparison
Output of
compare_nhanes().
Examples
sim <- sample_nhanes(n = 200, ages = 2:17, seed = 1)
plot_nhanes(compare_nhanes(sim))