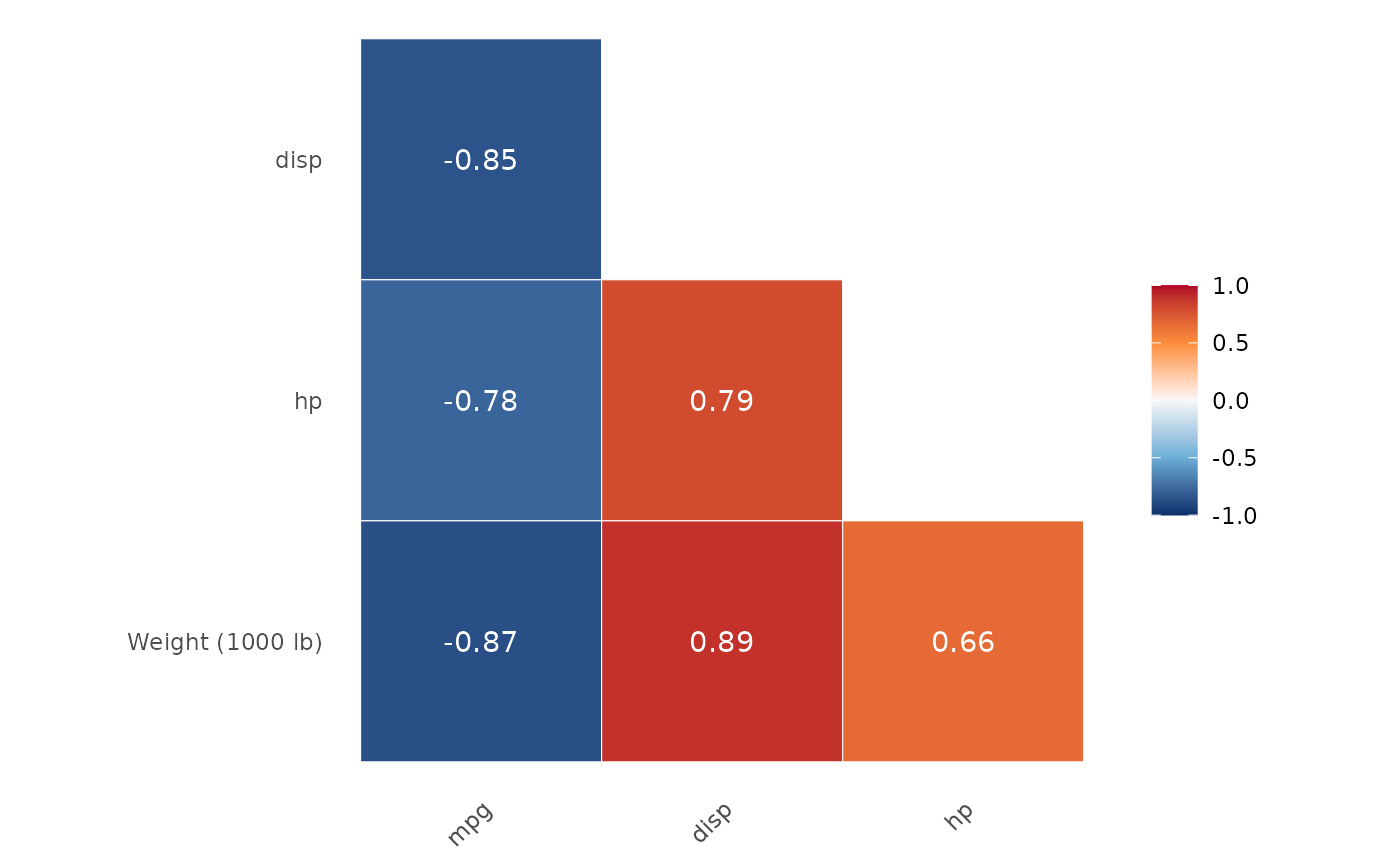
Draws the lower triangle of a correlation matrix as a heatmap, with blues for negative and oranges/reds for positive correlations, each cell labelled with its value.
Usage
plot_cor_triangle(
  R,
  types = NULL,
  labels = character(),
  digits = 2,
  text_size = 11
)
Arguments
- R
A square correlation matrix with column names, such as the output of
het_cor().- types
Optional matrix of correlation types (
"Pearson","Polyserial","Polychoric") with the same dimensions asR. When given, polyserial cells are marked*and polychoric cells**, and a footnote explains the marks.het_cor()supplies this whenplot = TRUE.- labels
Optional display labels, named by variable, e.g.
c(WT = "Body weight (kg)"). Unlabelled variables keep their names.- digits
Number of decimal places shown in each cell.
- text_size
Font size of the cell values, in points.